The basis of kpibench is the acquisition of operating data and machine data. The data required for this is automatically synchronized continuously from existing databases, or recorded directly in kpibench using IIoT data loggers.
This data is processed, enriched and processed into KPIs and information within kpibench. These are available to the user in different visualizations and reporting options in real time.
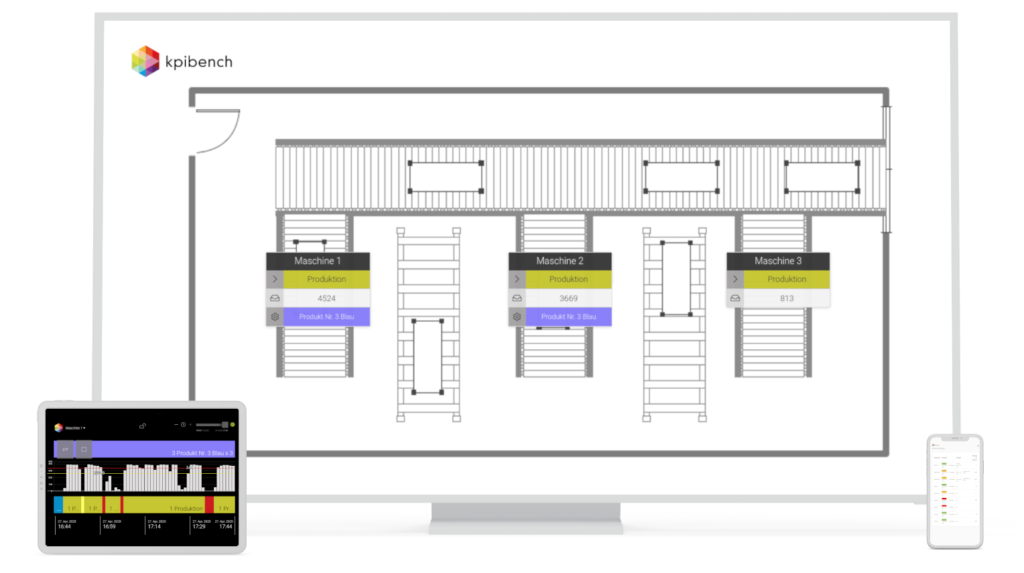
Visualization in real time
Clear presentation of your machine park on any device: hall monitors, PCs, tablets and smartphones.
Access from any device with standard browser, without the need to install special software – even remotely.
User-friendly performance monitor
Ideal for operation directly on the shop floor.
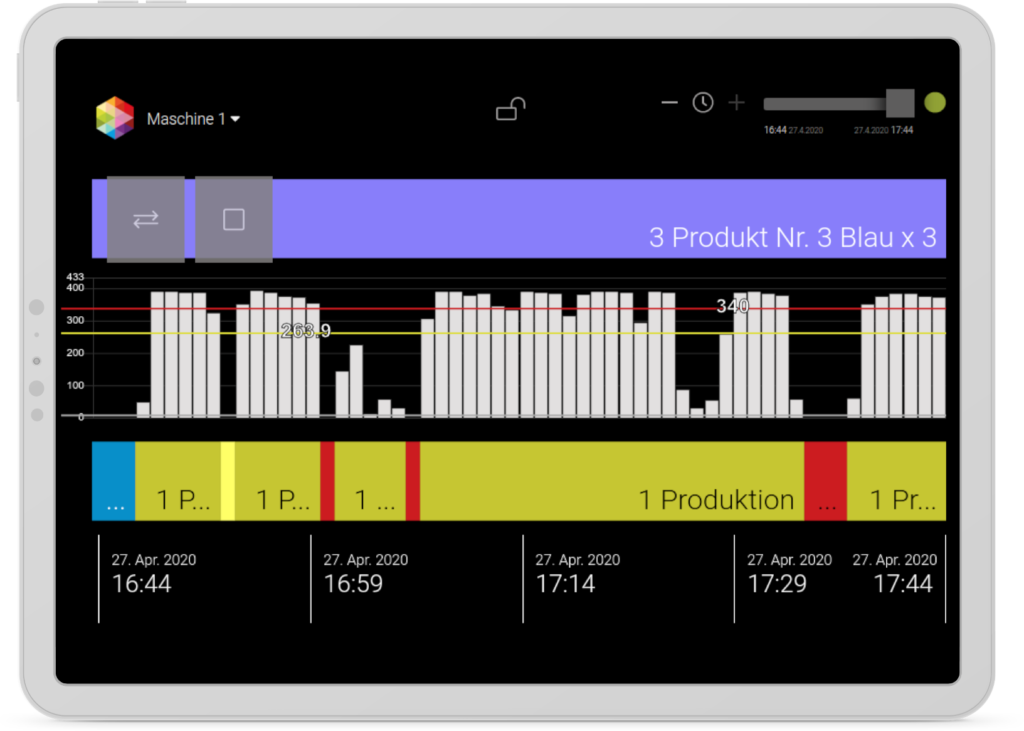
Intuitive timeline visualization:
Job information, product information, performance, machine state and relevant process parameters
For example occupancy of line segments, filling storage capacities, temperatures, air humidity, energy consumption.
Manual enrichment possible: classification of automatically detected downtimes, start / stop of products and jobs, triggering of instant alerts for maintenance.
Field-proven detailed reports
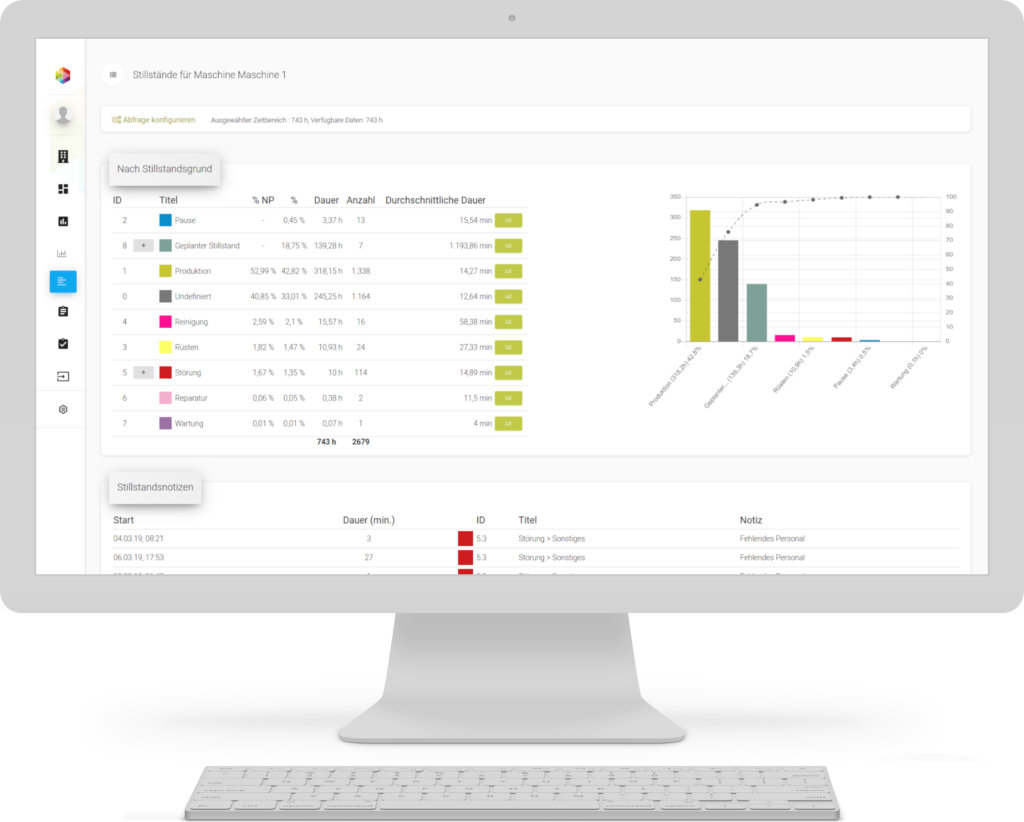
Quick evaluation with numerous predefined report segments.
KPIs such as OEE, time loss, speed loss, quality, utilization, availability. Details on unplanned downtimes, product comparisons, shift comparisons, and much more.
Flexible KPI model & catalogs
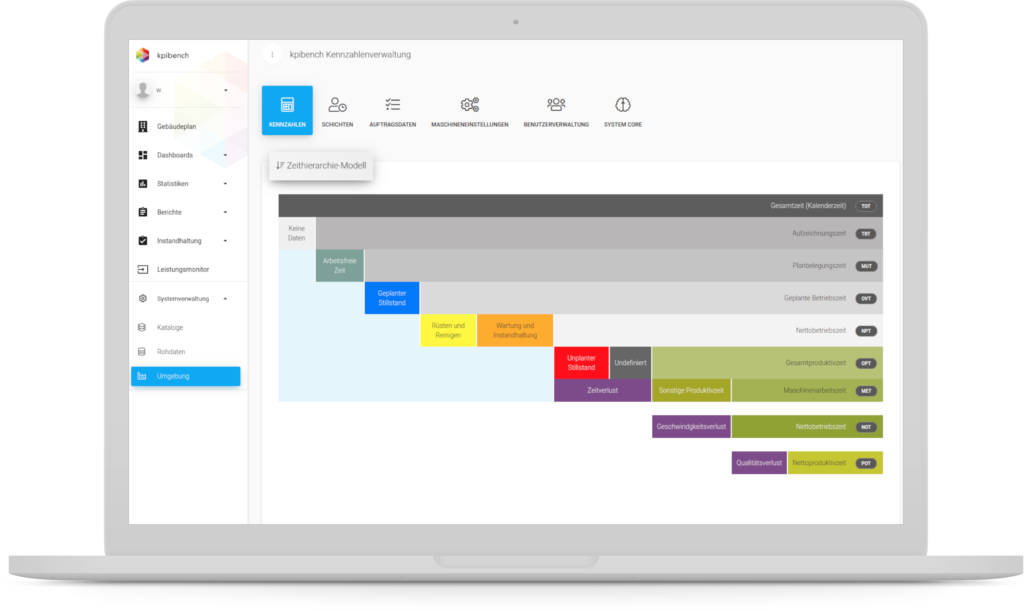
A standardized KPI model provides a constructive basis for discussion in the production team.
KPI and shift models, stoppage and article catalogs are flexible and freely adaptable.
See kpibench in action
Request your online demo now and see for yourself in a personal 15 to 30 minute web demonstration.